Demand Side Management Documentation
This documentation explains the Demand Side Management feature of urbs. With it, one can model time variant Demand Side Management Up/Downshift in a concrete energy system, for example, smart grid of a city.
Introduction
The DSM up/downshifts are closely related to commodities,
which are given by default in the urbs with their energy content (MWh).
The size of the modelled market has to be considered small relative to
the surrounding market. To use this feature, the excel input file needs
an additional Demand Side Management sheet with the five parameters
containing the columns delay, eff, recov, cap-max-do and
cap-max-up, which are used in DSM constraints as technical parameters.
For a more detailed description of the implementation have a look at the
mathematical definitions in the Mathematical Documentation, section
Demand Side Management Constraints.
Exemplification
This section contains prototypical scenarios illustrating the system
behaviour with time variant DSM up/downshifts.
In this part there is an island as an example named Greenland, which
composed of three sites Mid, North, and South. Between the
three sites most of the electricity from South has to be transported
to supply Mid. The electricity of North is relatively independent
of the other two sites.
When do the electricity DSM downshifts appear in the process?
- it is necessary to constraint the whole system with DSM downshifts, if the demand is greater than the total output capacity.
- it is profitable to constraint the whole system with DSM downshifts, if the commodity begin to show upward trend till the peak value.
When appears the electricity DSM upshifts in the process?
- it is possible and profitable to constraint the whole system with DSM upshifts, if the demand is lesser than the total output capacity and the commodity begin to show downward trend till the valley value.
High Maximal Up/Downshift Capacity
All process, transmission and storage capacities are predetermined and constant.
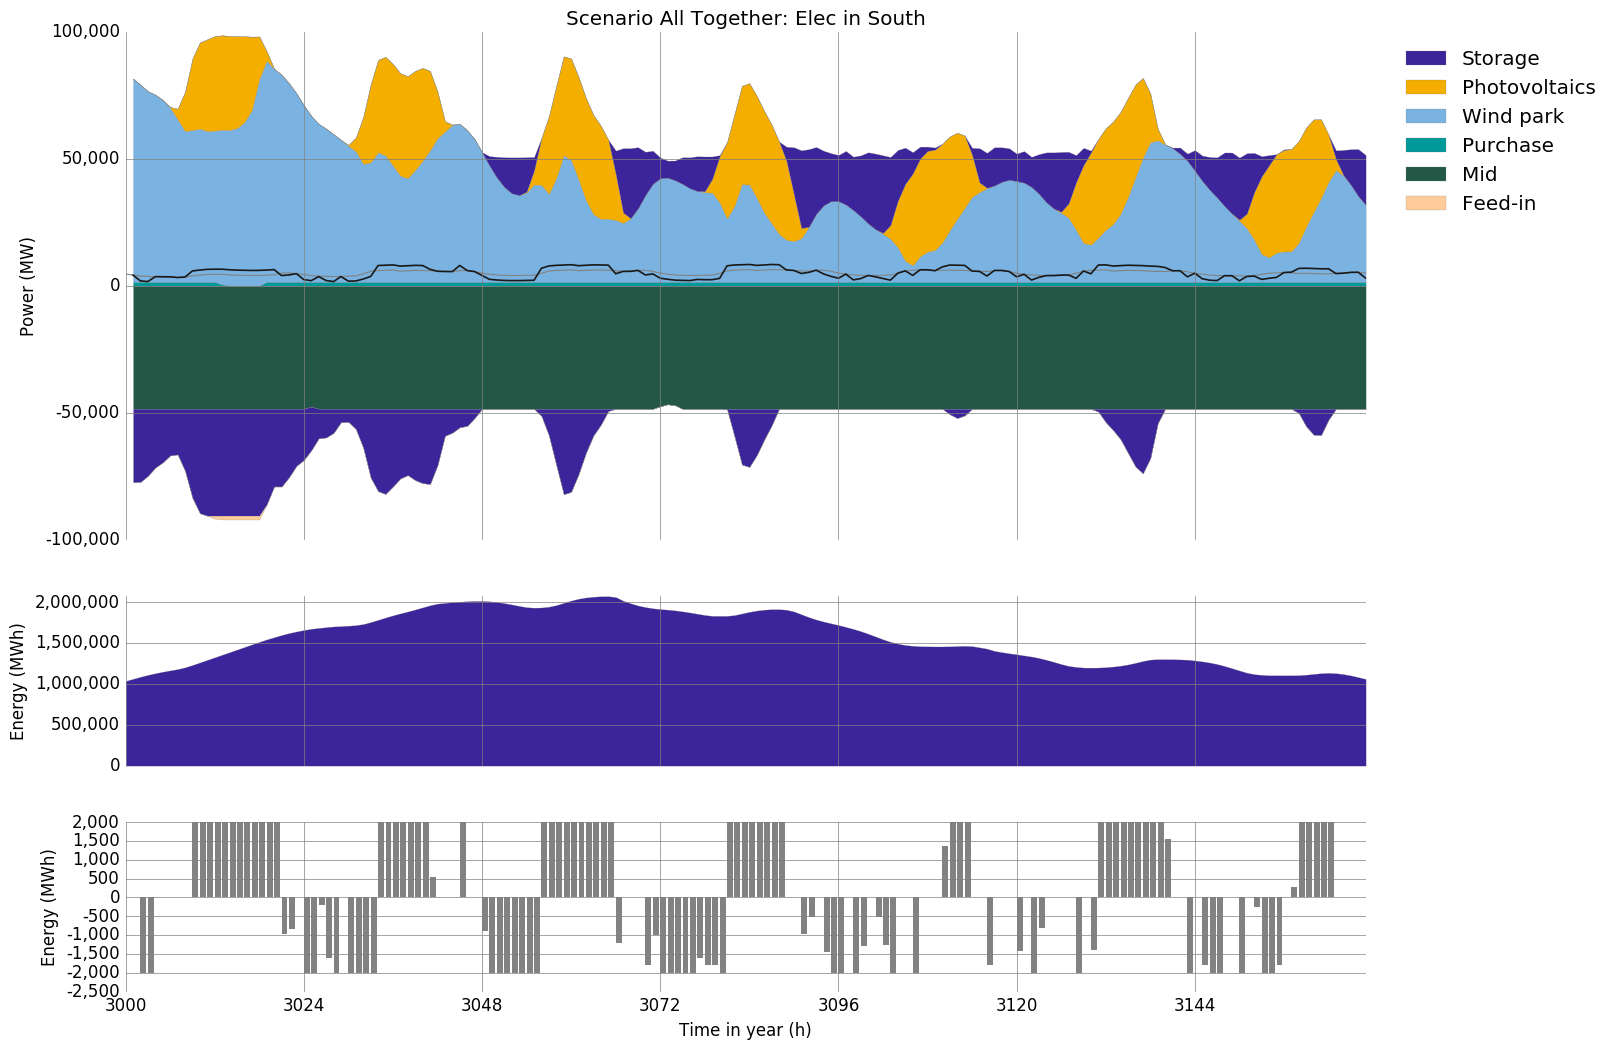
The following scenario illustrates the energy balance of the South of
greenland. It has a demand of 50-100 GW that is supplied by a 50 GW
photovoltaics plant and a 50 GW wind plant. In addition a 50 GW transmission
cable exports electricity, which connects the Mid of island with the grid
of South. Both capacities and prices are fix. Because of the meteorological
effects on Photovoltaics plants, the timesteps began at the 3000th hour of the
year, which was also the beginning of the summer.
| Process | eff | inst-cap | inst-cap-out | fuel-cost | var-cost | total-var-cost |
|---|---|---|---|---|---|---|
| Photovoltaics | 1.00 | 0 | 50000 | 0 | 0 | 0 |
| Wind plant | 1.00 | 0 | 100000 | 0 | 0 | 0 |
| Purchase | 1.00 | 0 | 1500 | 15/45/75 | 0 | 15/45/75 |
| Feed-in | 1.00 | 0 | 1500 | 15/45/75 | 0 | 15/45/75 |
| Site | Commodity | delay | eff | recov | cap-max-do | cap-max-up |
|---|---|---|---|---|---|---|
| South | Elec | 16 | 0.90 | 1 | 2000 | 2000 |
The modelled timesplan lasts 7 days with five parameters from DSM sheet in
greenland-south.xlsx. In the first ten hours of day 1 the electricity power
is at a high level, because the supply is much less than the demand. So the
DSM begins with downshifts. But the situation will change into opposite direction
over time. After the supply exceeds, the demand the DSM upshifts appears to
take place of downshifts. How much electricity can the photovoltaics plants and
awind plants generate all depending on the weather conditions. The wind plants
works the whole day 24 hours, as long as the wind blows strongly enough. But
photovoltaics plants generates electricity only in the daytime, that is why the
parameter delay is set to 16 hours. It just coincides the time in one day,
that is covered by the sunshine. Before the second day the wind blows strongly
enough, so that the surplus of wind plant generated electricity is converted
into storage. From the 3rd day the wind production decreases, and the electricity of
storage has to be taken out to meet the demand. At the midnight of the 5th day
electricity capacity come to the lowest point of all, and the output and input
keep nearly in balance. Not only the frequency of scenario_base up/downshifts,
but also the amount of times of up/downshifts will decrease correspondingly.
There is relative more volatility of electricity capacity in the seven days
simulation than it without DSM.
If the commodity stock prices, global CO2 limit and maximum installable capacity
in runme.py are not changed, and just only consider the scenario_base, it
will be more clearly to show how the DSM affects the electricity commodities.
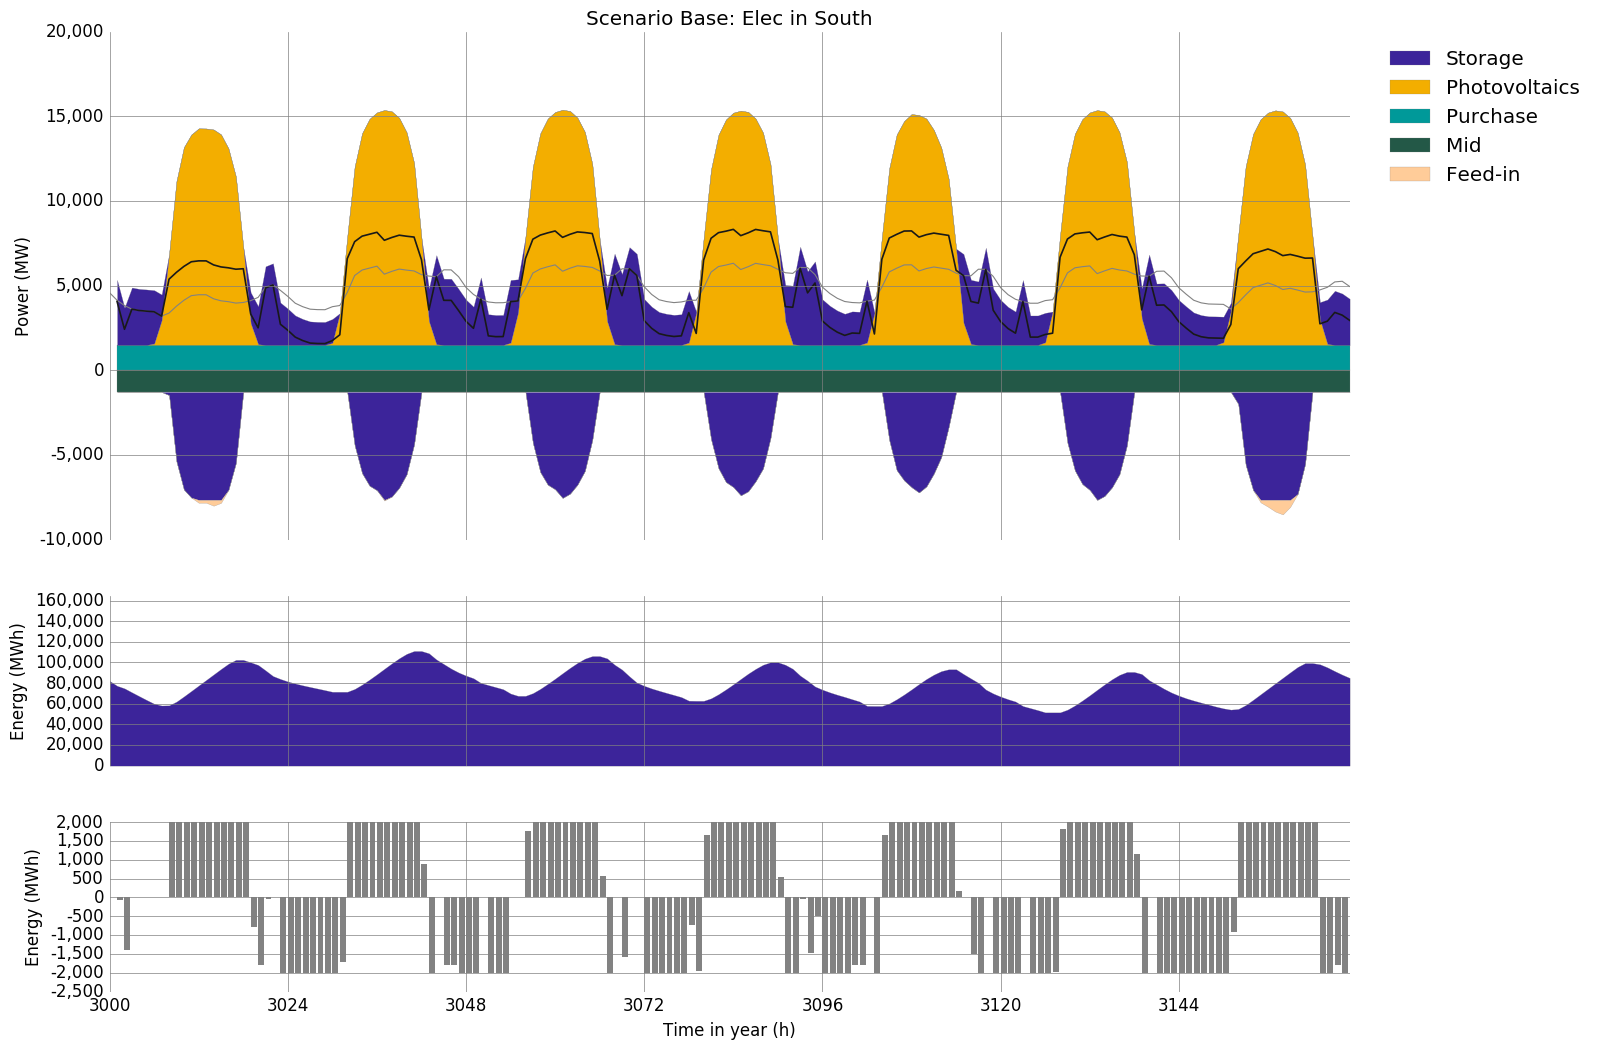
Note
For trial e.g. of the result of higher Demand Side Management this
greenland-south.xlsx
is the input file used for this scenario.
Low Maximal Up/Downshift Capacity
All process, transmission and storage capacities are predetermined and constant.
For the second scenario, the North of greenland will replaced the South.
Compared to the South, the electricity supply of North is relatively
simple and independent. It has a demand of 10000-15000 MW, and the supply is
dominated by wind plants. Additionally there is about 2500 MW needed to be
provided by Purchase.
| Process | eff | inst-cap | inst-cap-out | fuel-cost | var-cost | total-var-cost |
|---|---|---|---|---|---|---|
| Photovoltaics | 1.00 | 0 | 3000 | 0 | 0 | 0 |
| Wind plant | 1.00 | 0 | 15000 | 0 | 0 | 0 |
| Gas plant | 0.60 | 0 | 0 | 27 | 1.60 | 28.60 |
| Purchase | 1.00 | 1500 | 1500 | 15/45/75 | 0 | 15/45/75 |
| Feed-in | 1.00 | 2500 | 2500 | 15/45/75 | 0 | 15/45/75 |
| Site | Commodity | delay | eff | recov | cap-max-do | cap-max-up |
|---|---|---|---|---|---|---|
| North | Elec | 8 | 1.00 | 1 | 500 | 500 |
The modelled timesplan lasts also 7 days with five parameters from DSM sheet in
greenland-north.xlsx. The electricity supply of North is dominated by
wind plants. The wind plants works for 24 hours in one whole day, and the wind
power strong or weak has nothing to do with the change of time. So the parameter
delay is set to 8 hours. Because the peak value of the output of North
is just close to 15 GW, the cap-max-do and cap-max-up are set to 500 MW,
which is a quarter of South’s. The electricity in the first four days, which is
generated by wind plants, keeps at a higher level. That is why the up/downshifts
appear frequently, regularly, and alternately during this time. But in the last
three days the wind power gets lower, and the electricity of storage has to be taken
out to meet the demand. Then during the three days downshifts dominate in most
case. With DSM up/downshifts intelligent allocation of electricity resources is
required to avoid the shortage of electricity supply during peak hours and the
overcapacity in the usual time.
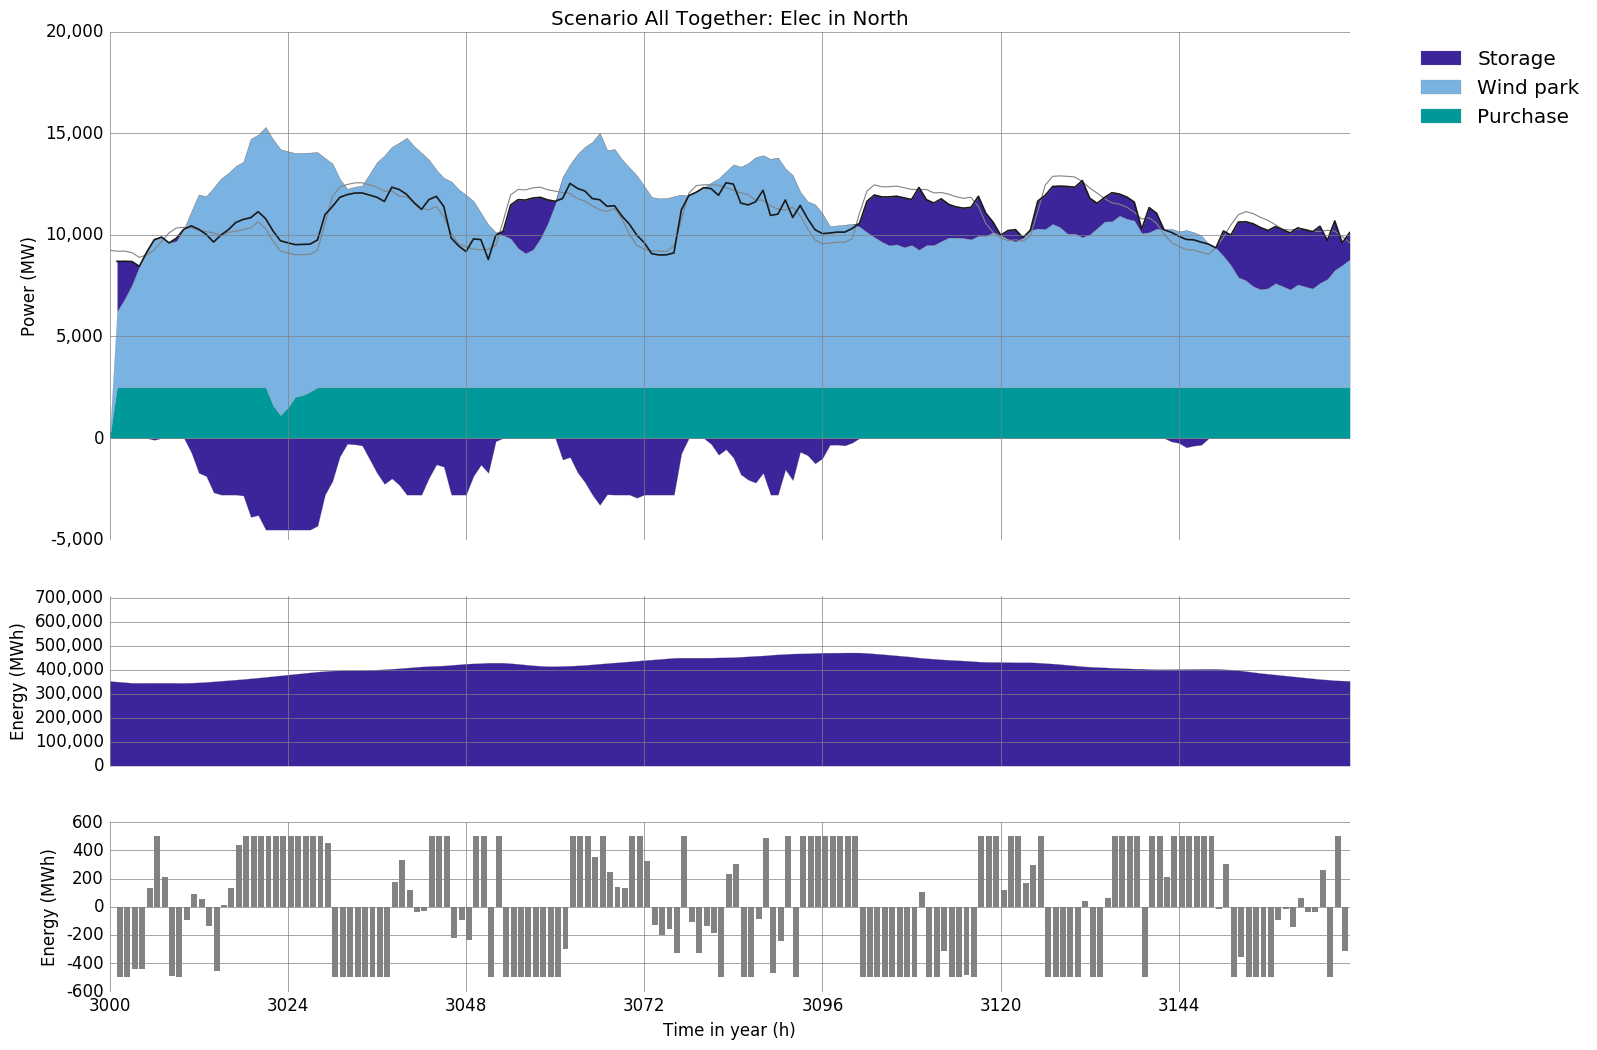
Note
For trial e.g. of the result of lower Demand Side Management this
greenland-north.xlsx
is the input file used for this scenario.
No Maximal Up/Downshift Capacity
All process, transmission and storage capacities are predetermined and constant.
The last scenario illustrates the energy balance of the Mid of greenland.
It has a demand of 50-70 GW that is mostly supplied by a 50 GW transmission, which
come from South. In addition, a 13 GW wind plant and 16 GW Photovoltaics plant
has made a contribution to the whole electricity system of Mid.
| Process | eff | inst-cap | inst-cap-out | fuel-cost | var-cost | total-var-cost |
|---|---|---|---|---|---|---|
| Photovoltaics | 1.00 | 15000 | 16000 | 0 | 0 | 0.00 |
| Wind plant | 1.00 | 0 | 13000 | 0 | 0 | 0.00 |
| Gas plant | 0.60 | 0 | 8000 | 27 | 1.60 | 28.60 |
| Hydro plant | 1.00 | 0 | 1400 | 6 | 1.40 | 7.40 |
| Lignite plant | 0.40 | 0 | 60000 | 0 | 0.60 | 0.60 |
| Biomass plant | 0.35 | 0 | 5000 | 6 | 1.40 | 7.40 |
| Site | Commodity | delay | eff | recov | cap-max-do | cap-max-up |
|---|---|---|---|---|---|---|
| Mid | Elec | 0 | 1.00 | 1 | 0 | 0 |
The Mid gets so adequate electricity import from the South, that
commodity of the Mid per unit time is far greater than maximal up/downshifts
capacity. That means it is meaningless for the setting of DSM faced with so
enormous commodity, which is far beyond the controllable range. Supposed that
the Mid is the city center, the largest energy customer, not the energy
producer, and then there is huge infrastructure inside, such as public traffic,
hospital, and communication system, which have to be supplied for 24 hours one
day. That’s why the parameters delay, cap-max-do and cap-max-up are
set to 0. It means that there was no more DSM in the electricity system of
Mid to constraint the commodities.
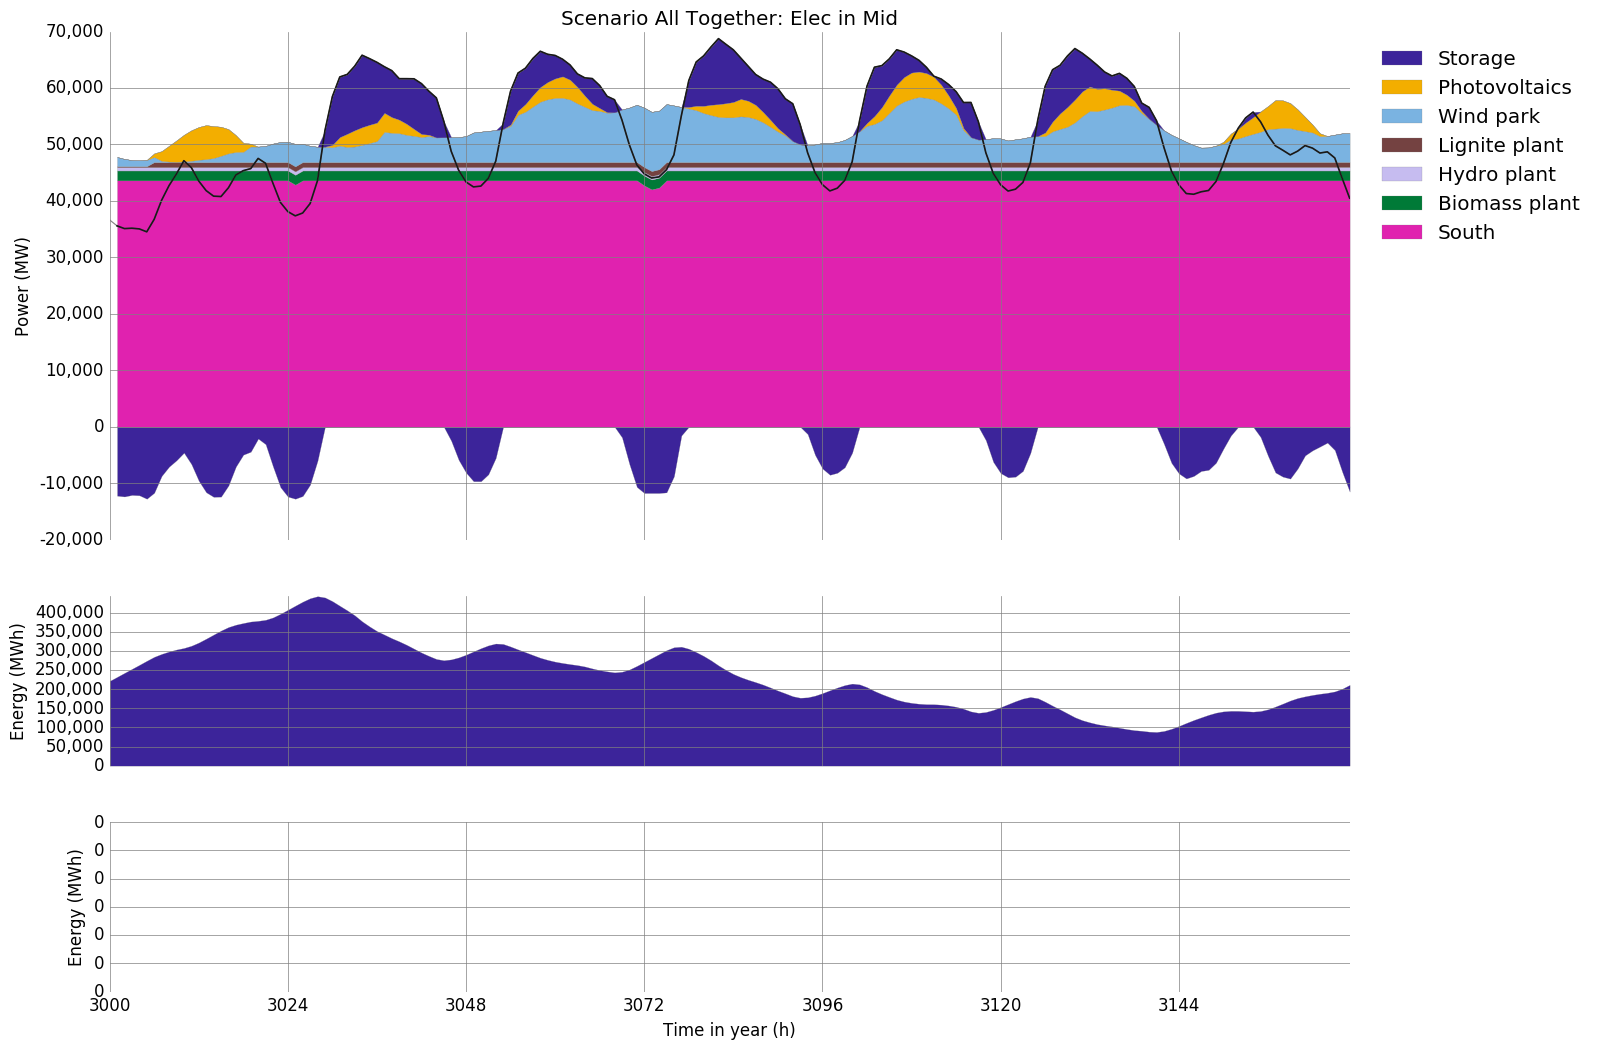
Note
For trial e.g. of the result of no Demand Side Management this
greenland-mid.xlsx
is the input file used for this scenario.