urbs: A linear optimisation model for distributed energy systems
| Maintainer: | Johannes Dorfner, <johannes.dorfner@tum.de> |
|---|---|
| Organization: | Chair of Renewable and Sustainable Energy Systems, Technical University of Munich |
| Version: | 0.7 |
| Date: | Oct 29, 2019 |
| Copyright: | The model code is licensed under the GNU General Public License 3.0. This documentation is licensed under a Creative Commons Attribution 4.0 International license. |
Contents
User’s manual
These documents give a general overview and help you getting started from after the installation (which is covered in the README.md file on GitHub) to you first running model.
Technical documentation
Continue here if you want to automate the scripting further, understand the model equations or extend the model yourself.
Features
- urbs is a linear programming model for multi-commodity energy systems with a focus on optimal storage sizing and use.
- It finds the minimum cost energy system to satisfy given demand timeseries for possibly multiple commodities (e.g. electricity).
- By default, operates on hourly-spaced timesteps (configurable).
- Thanks to pandas, complex data analysis code is short and extensible.
- The model itself is quite small thanks to relying on the Pyomo package.
- urbs includes reporting and plotting functions for rapid scenario development.
Changes
2017-01-13 Version 0.7
- Maintenance: Model file
urbs.pysplit into subfiles in folderurbs - Feature: Usable area in site implemented as possible constraint
- Feature: Plot function (and
get_timeseries) now support grouping of multiple sites - Feature: Environmental commodity costs (e.g. emission taxes or other pollution externalities)
- Bugfix: column Overproduction in report sheet did not respect DSM
2016-08-18 Version 0.6
- Demand Side Management Constraints added
- Partial & Startup Process Constraints added
- Various fixes in examples, docs and tutorials for Pyomo 4/Python 3 changes
2016-02-16 Version 0.5
- Support for Python 3 added
- Support for Pyomo 4 added, while maintaining Pyomo 3 support. Upgrading to Pyomo 4 is advised, as support while be dropped with the next release to support new features.
- New feature: maximal power gradient for conversion processes
- Documentation: Buy-Sell Documentation long explanation for Buy and Sell commodity types
- Documentation: Mathematical Documentation full listing of sets, parameter, variables, objective function and constraints in mathematical notation and textual expanation
- Documentation: updated installation notes in README.md
- Plotting: automatic sorting of time series by variance makes it easier to read stacked plots with many technologies
2015-07-29 Version 0.4
- Additional commodity types Buy and Sell, which support time-dependent prices.
- Persistence functions load and save, based on pickle, allow saving and retrieving input data and problem instances including results, for later re-plotting or re-analysis without having to solve them again.
- Documenation: Workflow tutorial added with example “Newsealand”
2014-12-05 Version 0.3
- Processes now support multiple inputs and multiple output commodities.
- As a consequence
plot()now plots commodity balance by processes, not input commodities. - urbs now supports input files with only a single site; simply delete all entries from the ‘Transmission’ spreadsheet and only use a single site name throughout your input.
- Moved hard-coded ‘Global CO2 limit’ constraint to dedicated “Hacks”
spreadsheet, while the constraint is
add_hacks(). - More docstrings and comments in the main file
urbs.py.
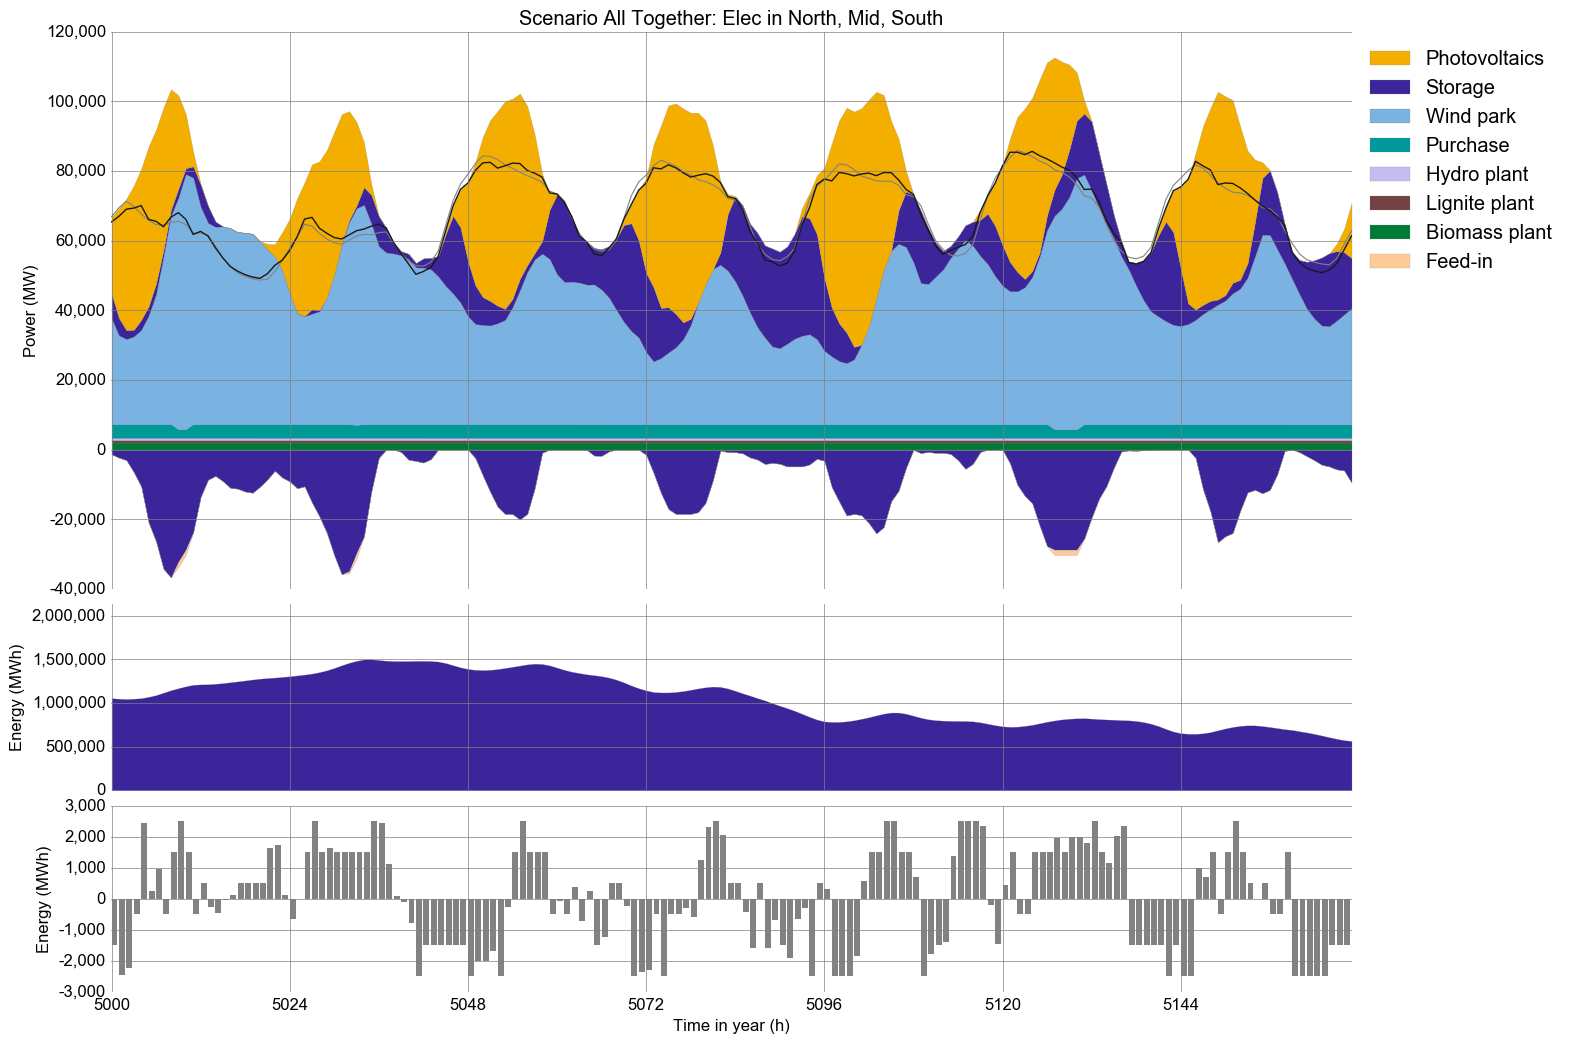
Screenshots
This is a typical result plot created by urbs.plot(), showing electricity
generation and storage levels in one site over 10 days (240 time steps):
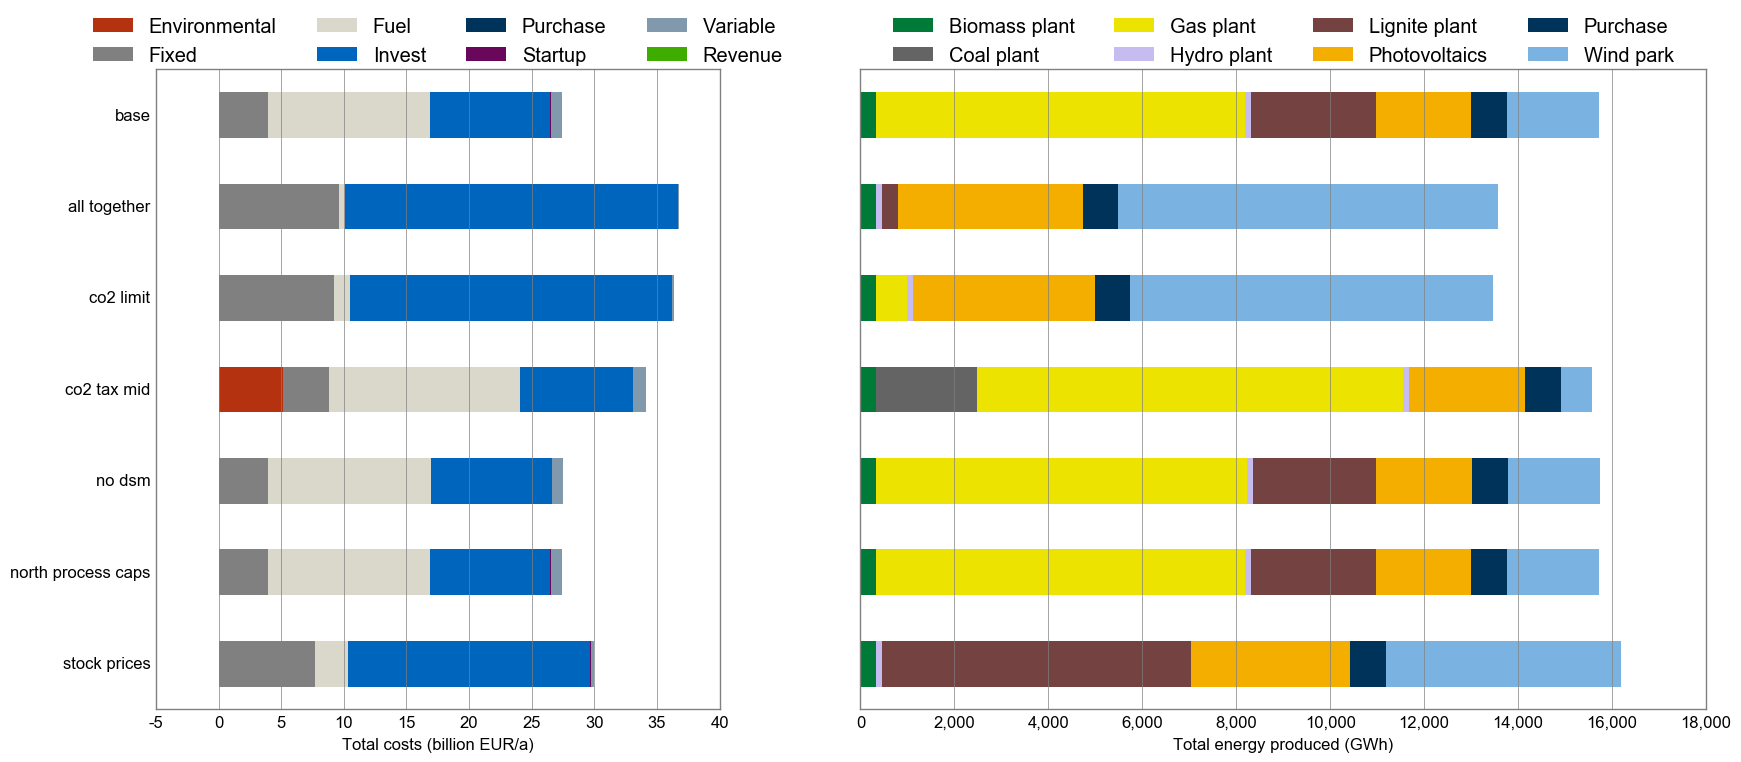
An exemplary comparison script comp.py shows how one can create automated
cross-scenario analyses with very few lines of pandas code. This resulting
figure shows system costs and generated electricity by energy source over five
scenarios:
Dependencies
- Python versions 2.7 or 3.x are both supported.
- pyomo for model equations and as the interface to optimisation solvers (CPLEX, GLPK, Gurobi, …). Version 4 recommended, as version 3 support (a.k.a. as coopr.pyomo) will be dropped soon.
- matplotlib for plotting due to its capability to customise everything.
- pandas for input and result data handling, report generation
- Any solver supported by pyomo; suggestion: GLPK